NB: This post is in response to Use Subqueries to Count Distinct 50X Faster and my comment on Hacker News.
On Periscope’s The High-Performance SQL Blog there is an article that shows how to improve the performance of COUNT(DISTINCT.... It begins by saying that these techniques are universal but goes on to focus on the performance benefits exclusively when they’re applied to PgSQL.
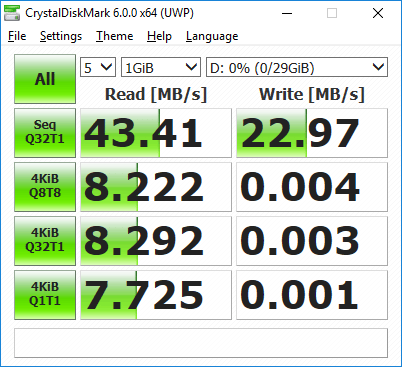
By way of comparison, I’ve tried to emulate their environment and techniques with MSSQL.
It’s not clear what hardware Periscope uses for their benchmarks. I suspect it’s more powerful than my computer, because their best result is 0.7 seconds with 10 million rows in time_on_site_logs whereas my best (when forcing SQL Server to generate serial plans like theirs) for 10 million rows is just under two seconds. I’m benchmarking on my computer:
- Windows 8.1 x64
- SQL Server 2012
- Intel Core i3 540
- 4GB RAM
- Intel SSD 520 Series
The Tables
Please forgive any inconsistencies in capitalization – I usually write my Queries LIKE 'This' but Periscope’s blog has SQL written like 'this'.
Don’t forgive any mistakes made translating Periscope’s experiment to MSSQL or in my analysis – let me know if I got anything wrong in the comments.
The structure is reverse-engineered from the queries in the blog post.
CREATE TABLE dashboards
(
    id INT NOT NULL IDENTITY(1, 1) PRIMARY KEY,
    name NVARCHAR(80) NOT NULL
);

CREATE TABLE time_on_site_logs
(
    id INT NOT NULL IDENTITY(1, 1) PRIMARY KEY,
    dashboard_id INT NOT NULL,
    CONSTRAINT FK_Time_On_Site_Logs_Dashboards
      FOREIGN KEY (dashboard_id)
      REFERENCES Dashboards(id),
    user_id INT NOT NULL
);
I didn’t bother with a users table and foreign key because as far as I know there’s nothing in the following queries that would benefit from it. (SQL Server can apply JOIN elision when working with trusted foreign keys … but we never JOIN to users)
The Data
Not knowing what the data is I made some guesses.
WITH cteNumbers AS
(
  SELECT 1 AS Number
  UNION ALL
  SELECT Number + 1
  FROM   cteNumbers
  WHERE  Number < 216
)
INSERT INTO dashboards(name)
SELECT CAST(cteNumbers.Number AS NVARCHAR(80))
  FROM cteNumbers
OPTION (MAXRECURSION 0);

INSERT INTO time_on_site_logs(dashboard_id, user_id)
SELECT dashboards.id, 1 + (RAND(CAST(NEWID() AS VARBINARY)) * 1000)
FROM   dashboards,
       dashboards A,
       dashboards B;

SELECT COUNT(*) FROM time_on_site_logs;
It’s slightly unrealistic because there are so many rows (10,077,696) that in practice the RAND... bits cause every user to visit every dashboard at least once, but should do for now.
The Indexes
Periscope say that assume the handy indices on user_id and dashboard_id are in place. The most handy indexes I can think of are as follows.
Note that I’m assuming that time_on_site_logs doesn’t have a natural key in dashboard_id and user_id – users might visit dashboards multiple times.
CREATE INDEX IX_Dashboard_Id
  ON time_on_site_logs (dashboard_id, user_id);

CREATE INDEX IX_User_Id
  ON time_on_site_logs (user_id, dashboard_id);
Both columns are included in the key rather than covered — the ordering helps when calculating DISTINCT.
Using covering indexes causes MSSQL to pick a different plan, but the performance is similar. The relative performance between each query is still the same … exactly the same.
I’m throwing in a unique index on dashboards.name too; if we’re going to report on dashboards by name it doesn’t make sense to have dashboards with the same name. No online retailer is looking at their sales reports and thinking that John Smith is their best customer and Amorette McFredson is their worst.
CREATE UNIQUE INDEX IX_Name
  ON dashboards (name);
The Queries
Modified for Transact-SQL and serial execution is enforced.
select
  dashboards.name,
  count(distinct time_on_site_logs.user_id)
from time_on_site_logs
join dashboards on time_on_site_logs.dashboard_id = dashboards.id
group by name
/* modified: was "order by count desc" */
order by count(distinct time_on_site_logs.user_id) desc
/* serial execution */
OPTION (MAXDOP 1);

select
  dashboards.name,
  log_counts.ct
from dashboards
join (
  select
    dashboard_id,
    count(distinct user_id) as ct
  from time_on_site_logs
  group by dashboard_id
) as log_counts
on log_counts.dashboard_id = dashboards.id
order by log_counts.ct desc
/* serial execution */
OPTION (MAXDOP 1);

select
  dashboards.name,
  log_counts.ct
from dashboards
join (
  select distinct_logs.dashboard_id,
  count(1) as ct
  from (
    select distinct dashboard_id, user_id
    from time_on_site_logs
  ) as distinct_logs
  group by distinct_logs.dashboard_id
) as log_counts
on log_counts.dashboard_id = dashboards.id
order by log_counts.ct desc
/* serial execution */
OPTION (MAXDOP 1);
The Results

Identical execution plans across the board. Approximately two seconds when running serially, one second when running in parallel.
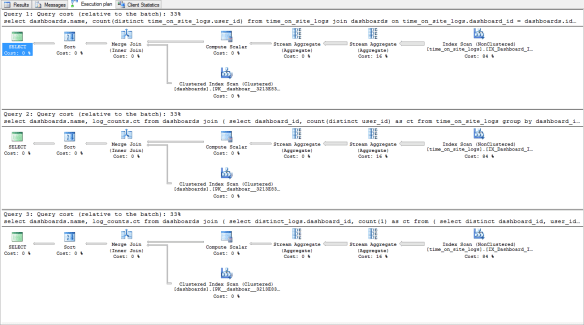
The parallel plans look similar to the above but with some parallel operators thrown in.
Conclusion
I’m quite sure to make of this. MSSQL did exactly what I thought it would do, but it’s not clear why PgSQL couldn’t generate the best plan from the simplest form the query.
It makes me wonder if MSSQL is so good at this because both MSSQL and the Entity Framework live under the Microsoft umbrella. EF produces queries that are straightforward but more verbose than an individual would write. Every optimization that MSSQL can make will make EF look better.
There’s a discussion to be had about the cost of free vs. proprietary tools and developer productivity … but I’m sure you’ve already drawn that conclusion.
A Word About dashboards.name
I don’t know whether the query that was chosen for optimization because it’s good for demonstrating the technique on PgSQL or because it represents a query that is actually in use. I don’t like group by name without knowing whether dashboard names are unique.
With that said, if it’s not unique then the query is arguably “wrong” because it aggregates results for distinct dashboard names rather than distinct dashboards.
Removing the unique index on dashboards.name does change the execution plan of the first query – it’s slightly worse than the other two (which remain identical). “Fixing” the first query to group by dashboards.id and dashboards.name causes the better plan to be generated again.